
Roshan Bhandari
Team Lead · Software Engineer · DevOps
Available for Projects
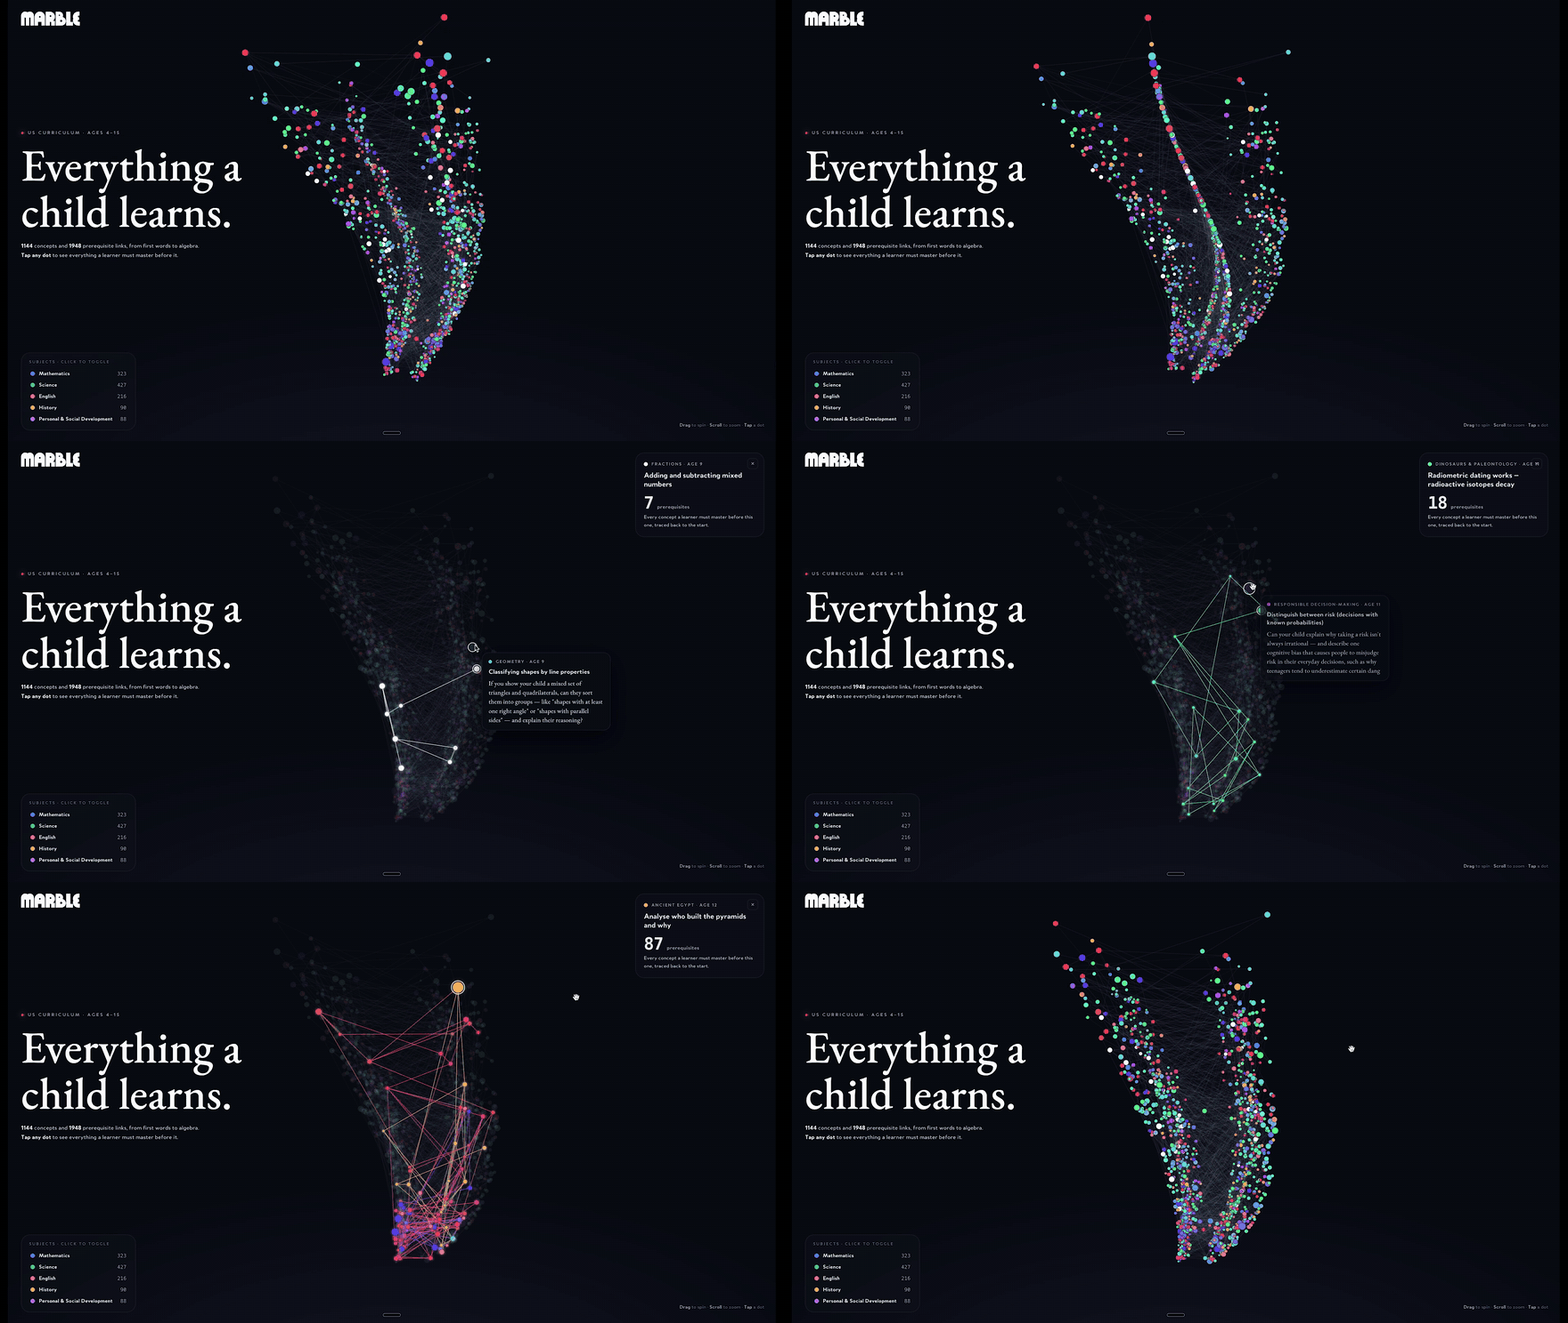
Most curriculum data exists as flat lists of standards buried in PDFs or locked inside proprietary platforms. This open taxonomy reimagines learning as a living, breathing graph where every skill connects to what came before and what comes next.
The Marble Skill Taxonomy transforms how we think about elementary education by breaking down learning into its smallest meaningful components. Rather than treating subjects as monolithic blocks, it decomposes the entire primary curriculum into 1,590 micro-topics — individual, teachable ideas that represent actual skills children master.
Each micro-topic includes plain-language descriptions, evidence criteria for mastery, categorization by type (conceptual, procedural, representational, language, or meta), subject and domain information, plus approximate age ranges. These aren't abstract academic concepts; they're concrete learning moments like "Building sentences" or "Apparent brightness of stars."
The real innovation lies in the connections. With 3,221 prerequisite dependencies, the taxonomy forms a directed acyclic graph showing exactly what foundational knowledge each skill requires. Every connection is tagged as hard or soft and includes a reason, making the learning pathway transparent and logical.
This isn't just data — it's infrastructure for building better educational tools. Here's what developers and educators can actually do with it:
The taxonomy spans eight subjects: Science (547 topics), Mathematics (503 topics), English (286 topics), History (90 topics), Personal & Social Development (88 topics), Life Skills (37 topics), Computing (21 topics), and Learning to Learn (18 topics). Each subject is organized into domain clusters with parent-friendly summaries, making complex learning progressions accessible to non-experts.
Educational technology has long suffered from fragmented data. Teachers piece together curriculum documents, standards are inconsistently defined across states and countries, and learning progressions remain implicit rather than explicit. This taxonomy addresses those pain points head-on.
The project's momentum reflects growing demand for interoperability in education. With 1,656 stars and counting, developers recognize that connected, open learning data enables a new generation of tools — from intelligent tutoring systems to comprehensive learning dashboards. The 3D visualization alone demonstrates the power of seeing learning as a network rather than a checklist.
Educators are equally excited because the taxonomy doesn't just describe what to teach; it explains why certain concepts must come before others. This clarity is invaluable for instructional planning, especially in elementary education where foundational skills cascade across subjects.
This taxonomy serves multiple audiences. EdTech developers building learning platforms, assessment tools, or adaptive systems will find immediate value in the structured, queryable format. Curriculum designers and instructional coaches can use it to audit existing sequences and design more coherent learning progressions.
Data scientists in education research can leverage the consistent schema and cross-curriculum alignment for large-scale learning analytics. Policy makers evaluating curriculum standards now have a reference implementation showing how to connect discrete learning objectives into meaningful pathways.
The data is language-agnostic and standards-aligned, making it useful for international applications. Since it's published as open JSON with no licensing restrictions, teams can integrate it directly into their products without vendor lock-in concerns.
All data lives in the data/ directory as UTF-8 JSON files. The core files include topics.json for micro-topics, dependencies.json for prerequisite edges, and curriculum-standards.json for source alignments. Each topic follows a consistent schema with id, type, subject, domain, name, description, and age range fields.
# Clone the repository
git clone https://github.com/withmarbleapp/os-taxonomy.git

# Explore the topics data
cat data/topics.json | head -20

# Load dependencies to build your graph
cat data/dependencies.json | jq '.[] | select(.type=="hard")'
For the full setup guide, see the official repository.